Bamburgh Castle © Brian Buchanan
Mapping the Data
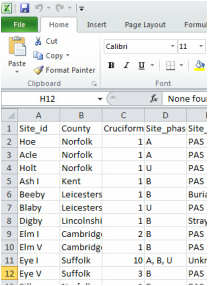
Geographic Information Systems (GIS) is an important software program used for combining large amounts of data. The full integration of all the data gathered through archival research and scientific analysis into a complex GIS is a core method for this project. GIS will be used to address the following questions:
What are the variations in burial rite, cemetery form, cemetery size, and how do these relate to traditional views on distinct groupings, territorial heartlands, and kingdoms?
What are the artefact distributions within and across the sites? How do these distributions relate to patterns of consumption, usage, and access to imported materials? How do artefact distributions facilitate the mapping of identity and status?
What are the health and wealth patterns of the funerary evidence as evidenced by the skeletal and scientific analyses?
What are the long-term patterns of local and long-distance movement and migration as shown in the scientific and artefactual data sets?
What are the spatial relationships between cemeteries and burials to other early medieval structures and monuments? Are there relationships to sites and monuments of earlier periods? What role did the natural environment play in cemetery location and use?
|
|